

先决条件
- kubernetes 集群中已经安装Prometheus-operator
- 了解Prometheus-operator serviceMonitor的感念
本文档不涉及helm以及ingress,promethues 安装部署,可查看以下链接查询相关文档
检查ingress是否存在controller-metrics Service
发现没有,应该是使用helm安装的时候没有开启metrics
1 | $ [K8sDev] kubectl get service -n nginx-ingress |
helm 升级ingress
查看已安装的helm ingress
1 | helm ls |
下载 fetch helm charts
1 | helm fetch stable/nginx-ingress && tar -xzvf nginx-ingress-1.4.0.tgz && cd nginx-ingress |
查看metrics Service 模板
helm chart template中controller-metrics-service.yaml是metrics service的模板,可以看到要渲染这个service 要将
controller.metrics.enabled```设置为**true**
2
3
4
5
6
7
8
9
10
11
12
13
14
15
16
17
18
19
20
21
22
23
24
25
26
27
28
29
30
31
32
33
34
35
36
37
38
39
40
41
42
43
44
45
cat templates/controller-metrics-service.yaml
{{- if and .Values.controller.stats.enabled .Values.controller.metrics.enabled }}
apiVersion: v1
kind: Service
metadata:
{{- if .Values.controller.metrics.service.annotations }}
annotations:
{{- range $key, $value := .Values.controller.metrics.service.annotations }}
{{ $key }}: {{ $value | quote }}
{{- end }}
{{- end }}
labels:
{{- if .Values.controller.metrics.service.labels }}
{{ toYaml .Values.controller.metrics.service.labels | indent 4 }}
{{- end }}
app: {{ template "nginx-ingress.name" . }}
chart: {{ .Chart.Name }}-{{ .Chart.Version }}
component: "{{ .Values.controller.name }}"
heritage: {{ .Release.Service }}
release: {{ .Release.Name }}
name: {{ template "nginx-ingress.controller.fullname" . }}-metrics
spec:
clusterIP: "{{ .Values.controller.metrics.service.clusterIP }}"
{{- if .Values.controller.metrics.service.externalIPs }}
externalIPs:
{{ toYaml .Values.controller.metrics.service.externalIPs | indent 4 }}
{{- end }}
{{- if .Values.controller.metrics.service.loadBalancerIP }}
loadBalancerIP: "{{ .Values.controller.metrics.service.loadBalancerIP }}"
{{- end }}
{{- if .Values.controller.metrics.service.loadBalancerSourceRanges }}
loadBalancerSourceRanges:
{{ toYaml .Values.controller.metrics.service.loadBalancerSourceRanges | indent 4 }}
{{- end }}
ports:
- name: metrics
port: {{ .Values.controller.metrics.service.servicePort }}
targetPort: metrics
selector:
app: {{ template "nginx-ingress.name" . }}
component: "{{ .Values.controller.name }}"
release: {{ .Release.Name }}
type: "{{ .Values.controller.metrics.service.type }}"
{{- end }}
升级nginx-ingress
1 | $ [K8sDev] helm upgrade public-porter \ |
为Ingress添加Prometheus ServiceMonitor
需要注意lable和matchLabels
2
3
4
5
6
7
8
9
10
11
12
13
14
15
16
17
18
19
20
21
22
23
24
kind: ServiceMonitor
metadata:
name: prometheus-self-ingress-controller-metrics
namespace: monitoring
labels:
app: prometheus-operator-ingress-controller
chart: prometheus-operator-5.0.11
heritage: Tiller
release: prometheus-operator
spec:
jobLabel: prometheus-controller
endpoints:
- port: metrics
interval: 30s
scheme: http
selector:
matchLabels:
app: nginx-ingress
component: controller
release: public-porter
namespaceSelector:
matchNames:
- nginx-ingress" |kubectl create -f -
Promethues 查看ingress 的metrics 数据
打开页面Status – Targets 查看是否添加成功

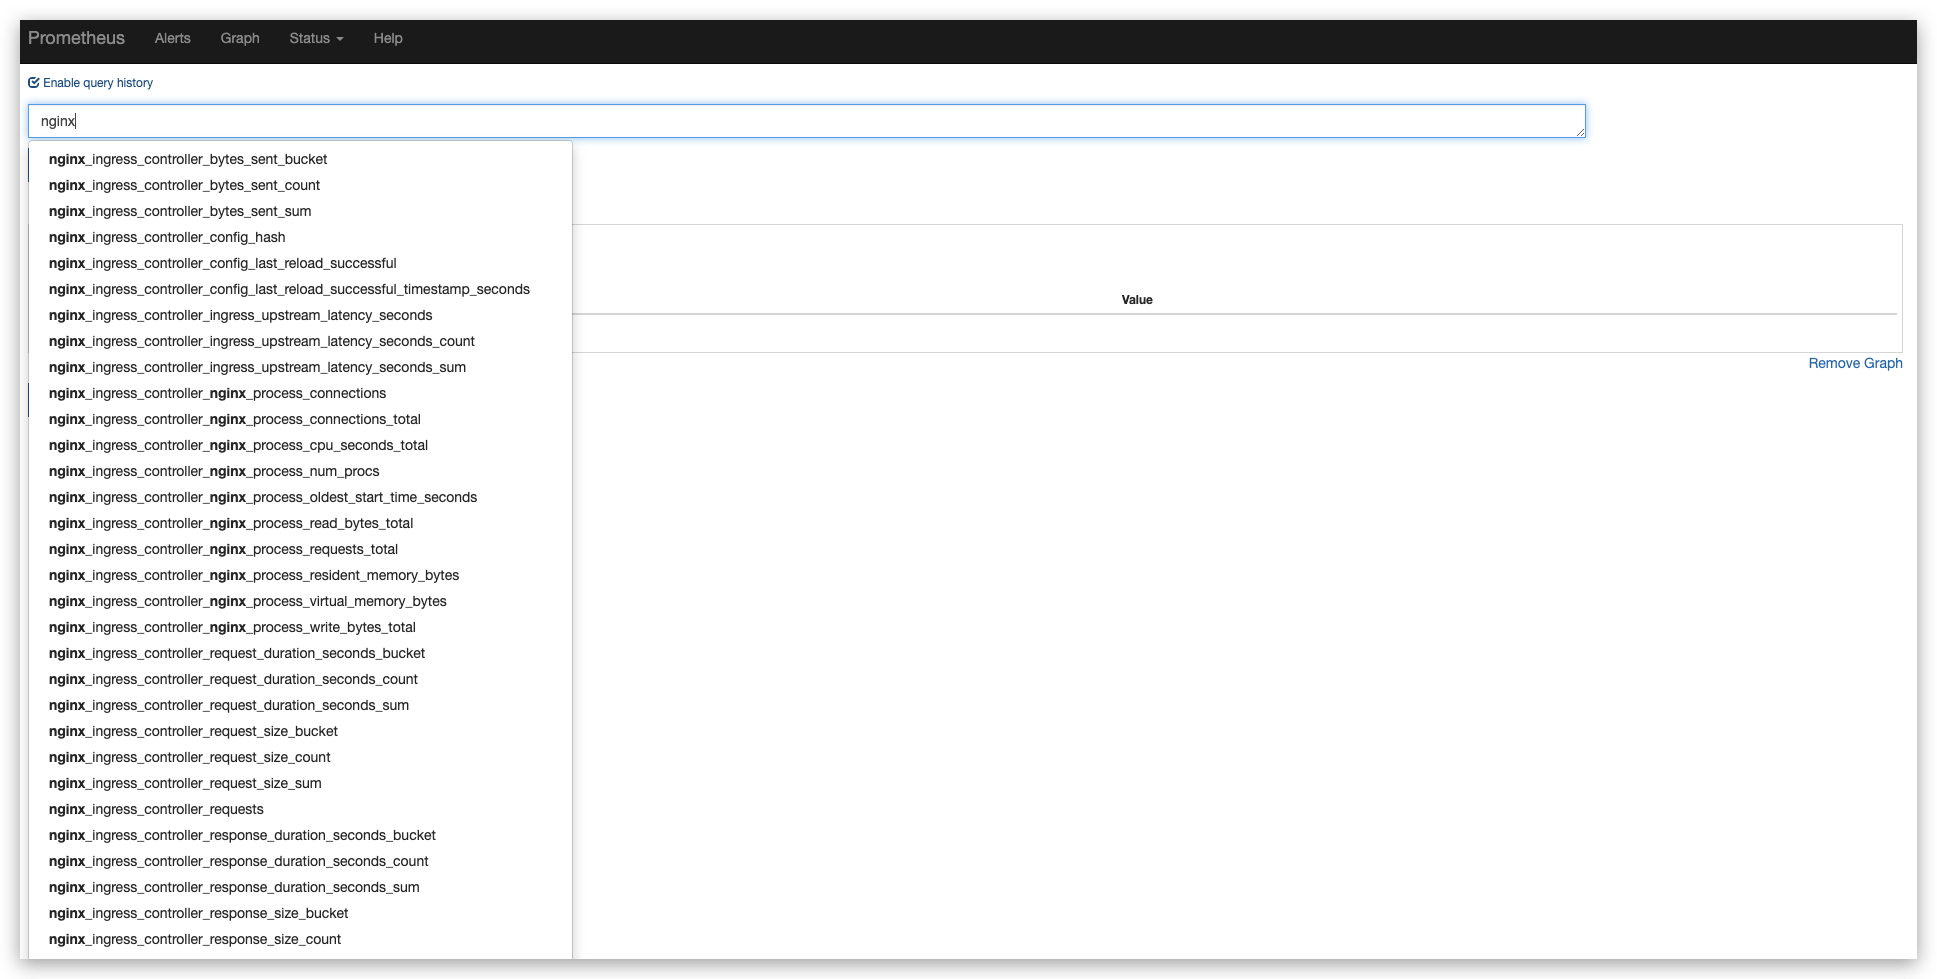
查询nginx-ingress监控数据
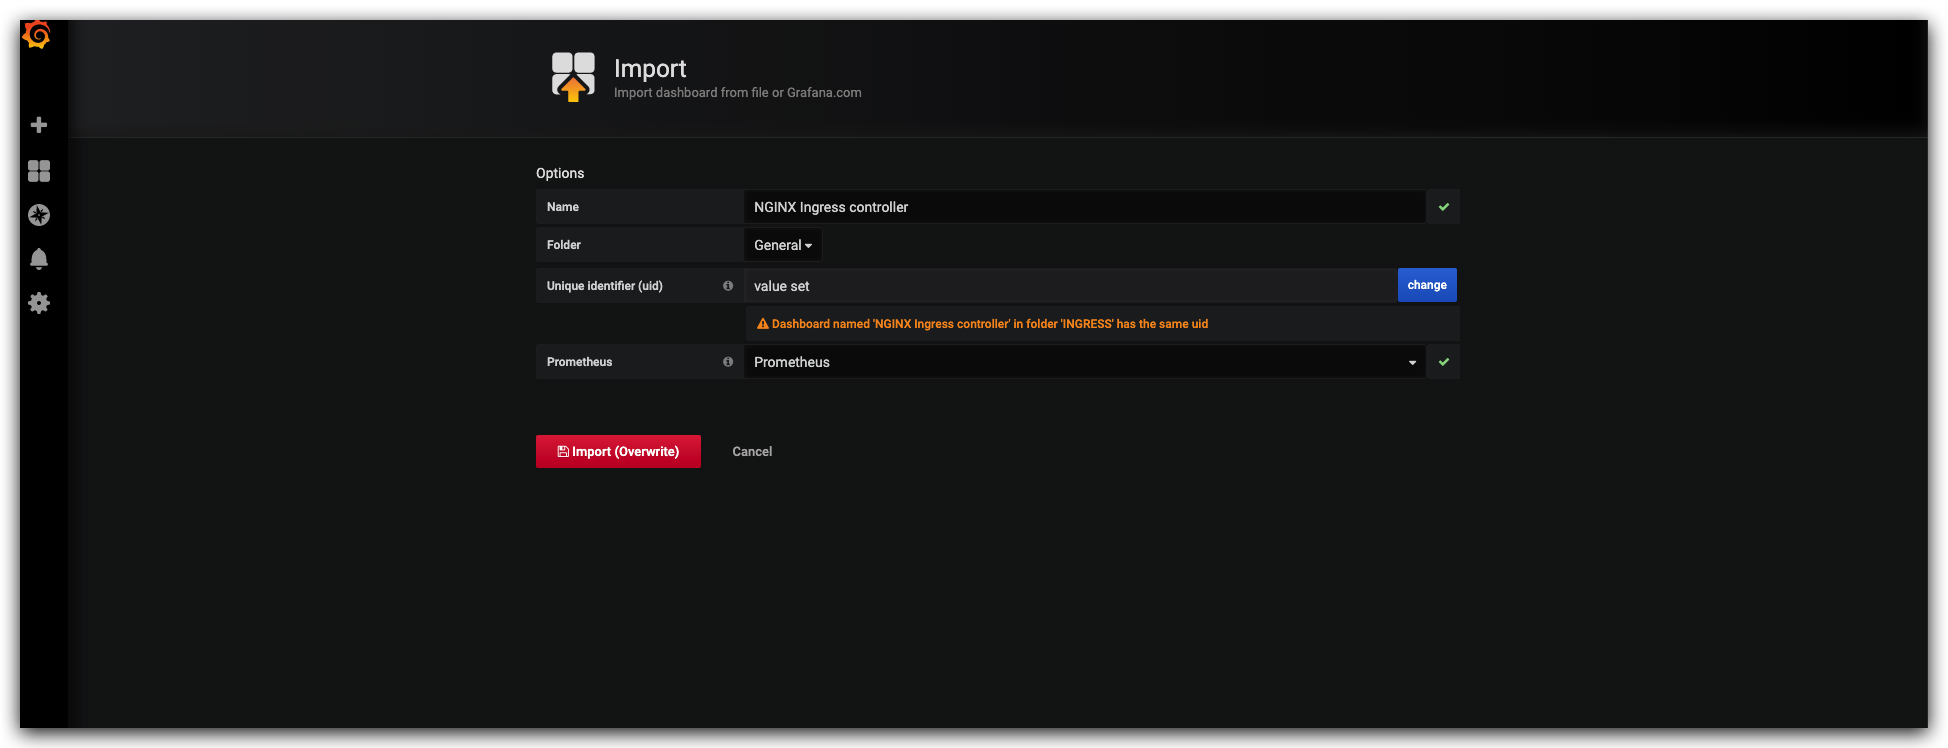
grafana 导入nginx-ingress Dashboard
1 | wget https://raw.githubusercontent.com/kubernetes/ingress-nginx/master/deploy/grafana/dashboards/nginx.json |
查看监控面板

- 本文作者: ChuLinx
- 本文链接: http://yoursite.com/2019/11/30/kubernetes Prometheus 监控Ingress-controller/
- 版权声明: 本博客所有文章除特别声明外,均采用 MIT 许可协议。转载请注明出处!